
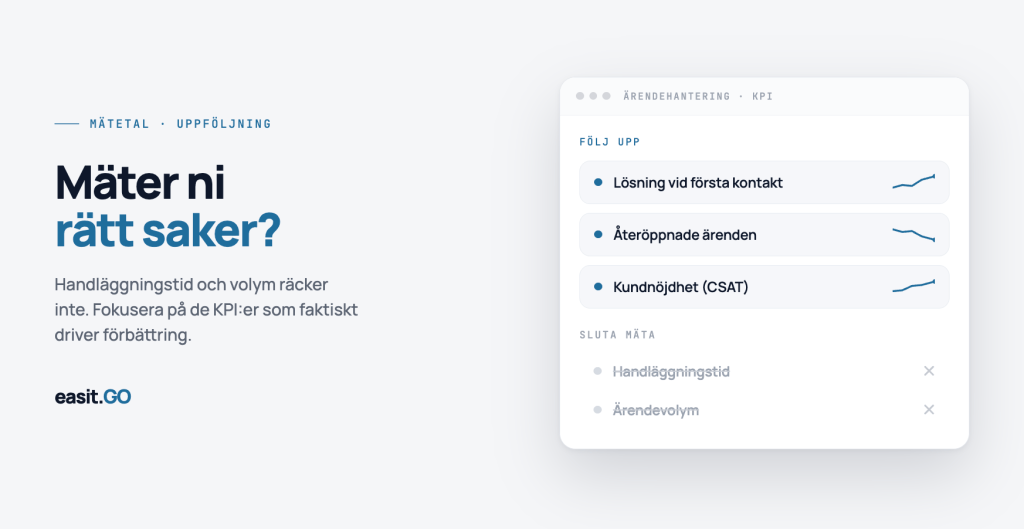
Many organizations that measure their case management measure the same things: how many cases came in and how long they took. That's a start. But it's not enough to understand whether the service is actually good or to know what needs to be improved.
The problem with measuring the wrong things
Case volume and processing time are easy to measure. The system records them automatically, and they can be presented in a chart without further processing.
The problem is that they don't tell you much about the quality of what you deliver.
A team that closes a lot of cases quickly may be doing so because they are closing cases before the problem is resolved. Low case volume may be because everything is great, or because employees have given up on reporting problems. Long turnaround times may indicate complex cases that require time, or simple cases are getting stuck in unnecessary queues.
Without the right metrics, you see activity, not results. And activity is not the same as delivery.
The KPIs that actually measure service quality
Four metrics are more informative than most others and should be included in all case management follow-ups.
First Contact Resolution (FCR)
FCR measures the percentage of cases that are resolved without having to be escalated, reopened or followed up with additional contacts. It is one of the strongest single measures of service quality, a case that is resolved on first contact means that the caseworker had the right skills, the right information and the right authority at the right time.
Low FCR is a symptom, not a root cause. It can be due to an insufficient knowledge base, incorrect escalation logic, or cases being assigned to teams that lack the right skills.
SLA compliance
SLA compliance measures the percentage of cases that are handled within the service levels you have committed to. It is a measure of whether the system delivers what you have promised and whether the commitments you have made are realistic.
High compliance with poor SLAs is not a measure of success. Therefore, SLA follow-up should always be combined with a review of whether service levels reflect real needs.
Customer Satisfaction (CSAT)
Quantitative metrics don't tell us what employees actually experienced. A short satisfaction survey after cases are closed provides a dimension that processing times don't capture: whether the person who sought help felt they received it.
CSAT is also an early warning system. If satisfaction is dropping but volumes and turnaround times look normal, there is a quality problem that is not visible in the numbers.
Escalation frequency
What percentage of cases are escalated and where? A high escalation rate may indicate that cases are assigned incorrectly from the start, that the level of knowledge on the first line is insufficient, or that case types are misclassified.
Volume as a diagnostic, not as a goal
Case volume is useful, but as a diagnostic tool and not as a primary follow-up measure.
What is interesting is not how many cases were received in total. It is how the volume is distributed by case type, by time and by group.
A category that generates a disproportionate number of cases is often a symptom of an underlying problem: a system that is struggling, a process that is unclear, or a flaw in the self-service portal. Case volume by category, tracked over time, makes visible the patterns that otherwise remain invisible.
Similarly, case volume at any given time is valuable for capacity planning: when is the load heaviest? Does staffing match the inflow?
What you should stop measuring or stop drawing conclusions about
Average turnaround time is misleading as a single metric. It hides variation: a team with an average turnaround time of four hours may have half of its cases resolved in one hour and the other half in seven. The average hides the problem.
Always supplement the average with the median and distribution. This gives a more honest picture of what it actually looks like.
Number of cases closed per caseworker is a metric that easily creates the wrong behavior. It encourages closing cases quickly rather than resolving them properly and correlates poorly with quality.
Follow-up in Easit GO
In Easit GO, reports and dashboards are built directly on case data. KPIs such as handling time, SLA compliance and escalation frequency are automatically calculated based on the timestamps and statuses recorded in each case.
Reports can be filtered by case type, group, time period, and a variety of other dimensions. This means you can track the same KPIs for IT support, HR, and facilities separately – and compare them over time without manual processing.
Automation rules can be linked to metrics. If a case is at risk of missing its SLA, an escalation is automatically triggered before the deadline expires.
Frequently asked questions
What KPIs should be measured in case management?
The most important are FCR (first contact resolved), SLA compliance, customer satisfaction (CSAT) and escalation rate. Supplement with case volume by category to identify patterns and root causes.
What is FCR – First Contact Resolution?
FCR measures the percentage of cases that are resolved on first contact without escalation, reopening, or follow-up. It is one of the strongest measures of service quality because it combines efficiency with actual resolution.
How do you follow up on KPIs in Easit GO?
Reports and dashboards are built directly on case data. KPIs are calculated automatically and can be filtered by case type, group and time period. There are also ready-made integrations with Microsoft Power BI and other tools.
Measuring case management is easy. Measuring the right things—and drawing the right conclusions from them—requires you to know what you’re looking for. Start with FCR, SLA compliance, and customer satisfaction. Add volume analysis by category. And review metrics with spread, not just averages.
Want to see how reports and KPI tracking work in Easit GO? Book a demo
Read more

Henrik Traveler
Commercial Product Manager
henrik.resare@easit.com
+46 70 249 36 06